
Cost-Efficient Management of Railway Bridges: should a bridge be repaired or replaced considering LCC and User cost aspects?
1 Case Studies
1.1 Case-Study (1): Repair or Replace a bridge?
1.1.1 Bridge outlines
On some occasions, the choice has to be made between two or more strategies to upkeep a specific bridge. Lillån Bridge in Sweden was constructed in 1934. The bridge is a simply supported concrete beam,Figure 5‑1. The total bridge length is 9.3 m with a total width of 5.5 m. The average daily traffic is 619 and design speed limit is 80 km/h. The average number of trucks that cross the bridge on a daily bases is 43. The traffic growth rate in the bridge region is expected to be 1 %. According to BaTMan, this bridge has a number [6-367-1], which refers to [County number-Section/Junction number in the rout-Bridge number in the Section/Junction].
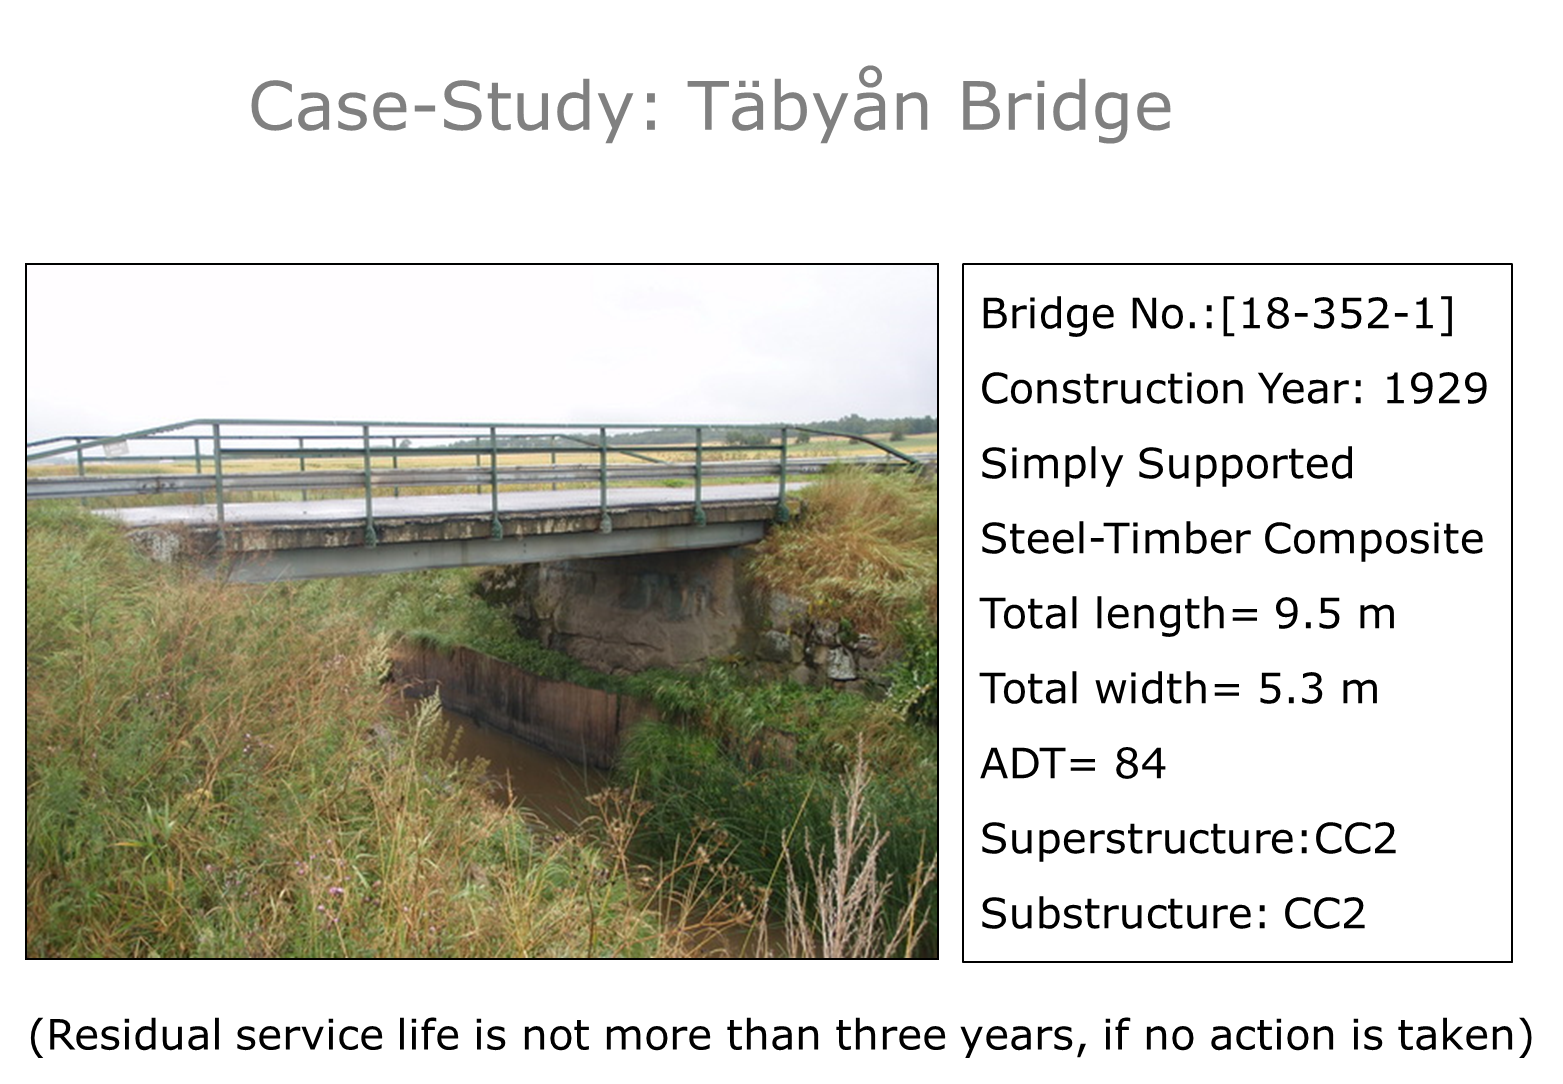
Figure 5‑1 [6-367-1] Bridge’s layout
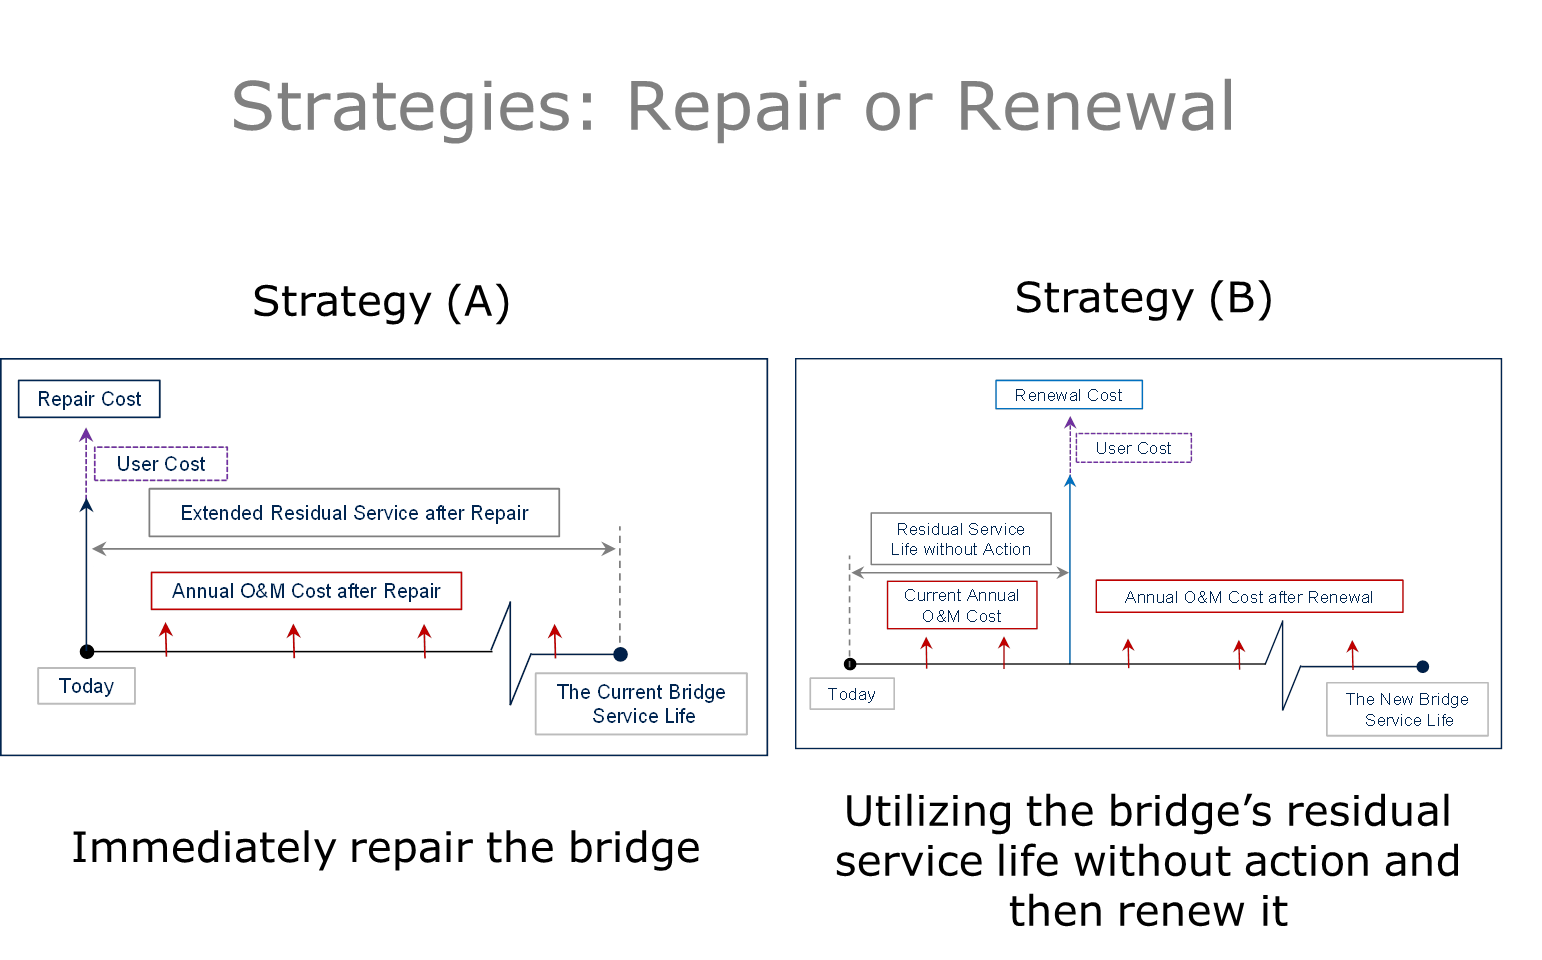
The bridge superstructure and substructure are deemed to be in such a condition that their residual service life is not more than three years, if no action is taken (BaTMan’s CC 2). Few strategies were proposed to upkeep this bridge. The choice stands between immediately repairing the bridge or utilizing its residual service life without action then replacing the entire bridge, respectively shown in Figure 5‑4 and Figure 5‑5.
Using an updated on-line well-defined price list for all bridge repair actions in BaTMan, it is estimated that the repair strategy will cost 895,000 SEK; mending the substructure, new bridge deck, surfacing, waterproofing and railings. Considering a statistical treatment of an intensive historical data extracted from BaTMan related to similar actions performed on similar bridges, the bridge after implementing this repair strategy is expected to last for 20 years at most with normal maintenance.
1.1.2 Benefits of using BaTMan’s inventory data
Currently, although the BaTMan inventory data is accessible by Webhybris, the decision-makers do not effectively benefit from it. However, in this case study, cost records for 2,508 bridges constructed between 1980 and 2011 were extracted from BaTMan using WebHybris and sorted according to the bridge types and length categories. Figure 5‑2 presents the bridge types applicable for each length category as well as the average costs/m2 for each type. The average inflation rate was calculated, Figure 5‑3, and included in the costs/m2 presented in Figure 5‑2.

Figure 5‑2 The average real initial costs of the Swedish bridges’ different types with respect to the total bridge length
Considering Figure 5‑2 and deeper classification of the extracted data, three replacement options were proposed and presented in Table 5‑6. It is important to note that, in Figure 5‑2, the lowest cost/m2 does not necessarily mean the cheapest bridge type because the required bridge total area, for a certain bridge location, differs from one bridge type to another.
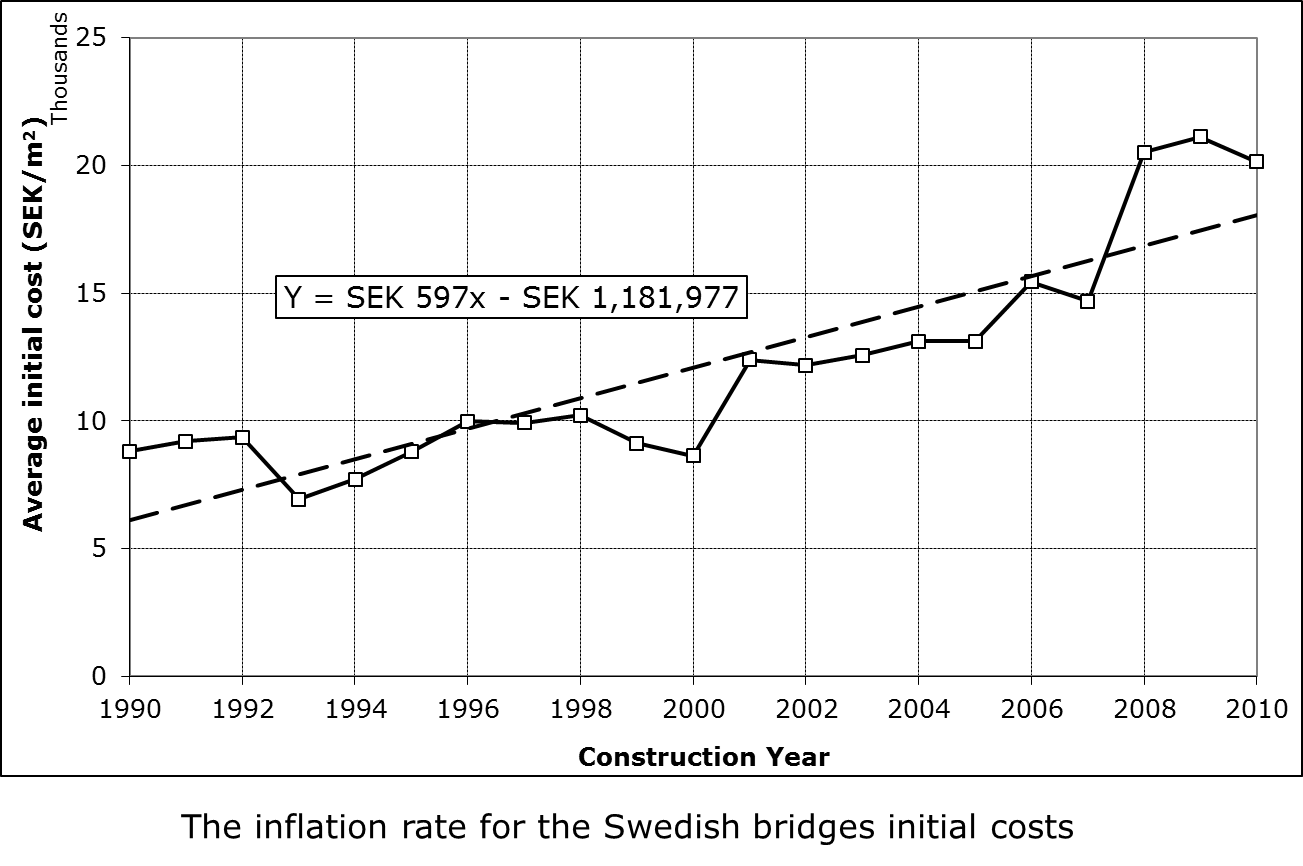
Figure 5‑3 The inflation rate for the Swedish bridge’s initial costs
Table 5‑1 Description of the bridge replacement proposals
| Proposal
NO. |
Proposal description | Bridge Width(m) | Bridge Length (m) | Anticipated initial cost (SEK/m2)
at year 2015 |
Anticipated service life (Year) | Required annual O&M (SEK) | Required construction duration (Day) |
| 1 | Steel-Timber Composite Beam | 7 | 16,5 | 12,578 | 80 | 8,500 | 100 |
| 2 | Concrete Beam | 7 | 16,5 | 23,510 | 100 | 5,000 | 100 |
| 3 | Steel Open-Bottom Arch Culvert | 8 | 9,5 | 19,400 | 60 | 2,500 | 80 |
The analysis was conducted in two steps. The first step is to optimize between the available replacement options. The second step is to optimize between the promoted replacement proposal and the repair strategy.
1.1.3 Replacement options optimization
Considering the proposals’ data given in Table 5‑1, the BLCCA was conducted. Only the bridge initial cost and annual operation and maintenance (O&M) cost were included in analysis. The inflation rate presented in Figure 5‑3 is used to anticipate the initial cost of the proposals at year 2015. The real service life of the different types of the Swedish bridges was presented in [13]. The required O&M cost of the different proposals was assessed by some of Trafikverket’s specialists. The O&M costs for the first proposal are including the needed periodic repainting of the steel superstructure and the annual tightening of the timber deck. Because the proposals have unequal anticipated service life, the EAC is used as the criteria for the project selection. The discount rate used in 4 %. The analysis, excluding the use cost, shows that the arch culvert is associated with the least EAC of 67,671 SEK/year. The analysis including the user cost has furthermore promoted the culvert alternative. Therefore, the culvert bridge is chosen as the most cost-effective replacement option.
1.1.4 Replacement or repair optimization
In this step, an optimization process will be conducted to compare the repair strategy (A) with the steel arch culvert as the replacement strategy (B). Table 5‑2 presents the strategies’ specifications. Figure 5‑4 and Figure 5‑5 present the cash flow of strategy (A) and (B) respectively.
Table 5‑2 Bridge repair and replacement strategy’s data
| Strategies Input Data | Strategy (A) | Strategy (B) | |
| Strategies description | Immediate repair | Utilizing the bridge residual service life without action and then replace it by a steel open-bottom arch culvert | |
| Bridge’s Residual service life without action, (Years) | 3 | ||
| Discount rate (%) | 4 | ||
| Anticipated service life after an action (Year) | 20 | 60 | |
| Strategy initial cost (SEK) | 895,000 | 1,474,400 | |
| Annual O&M cost (SEK) | 7,000 | During the current bridge residual service life | After the bridge replacement |
| 8,500 | 2,500 | ||
| The required construction duration (Days) | 60 | 80 | |
| Figure 5‑4 Strategy (A): Immediately repair the bridge | Figure 5‑5 Strategy (B): Utilizing the bridge’s residual service life without action and then renew it |
1.1.5 Analysis excluding the bridge user cost
The LCC analysis was conducted based on the given strategies’ specifications on Table 5‑2. As shown in Table 5‑3, The NPV of strategy (A) is less than (B). However, this does not mean that strategy (A) is the most cost-effective, simply because the strategies have unequal life-span. Therefore, the EAC was calculated for each strategy, shown In Table 5‑3.The EAC of strategy (B) is less than (A). Consequently, strategy (B) is the most cost-effective strategy. Using equation 4 and 5, the NS and the OL were calculated. The NS is equal to 282,864 SEK/63 years or 12,359 SEK/year for a life span equals to 63 years. The OL is equal to 167,963 SEK/20 years or 12,359 SEK/year for a life span equals to 20 years.
Table 5‑3 LCC analysis results excluding the bridge user cost
| Cost Category &Term | Strategy (A) | Strategy (B) |
| Net Present Value (SEK) | 990,132 | 1,384,605 |
| Equivalent Annual Cost (SEK/year) | 72,856 | 60,497 |
By performing sensitivity analysis to study the impact of varying the discount rate (r) from zero to 2r, Figure 5‑6, strategy (B) remains the most cost-effective strategy as the discount rate is less than 8 %. Therefore, in this case, the discount rate does not have any considerable impact on the final decision.
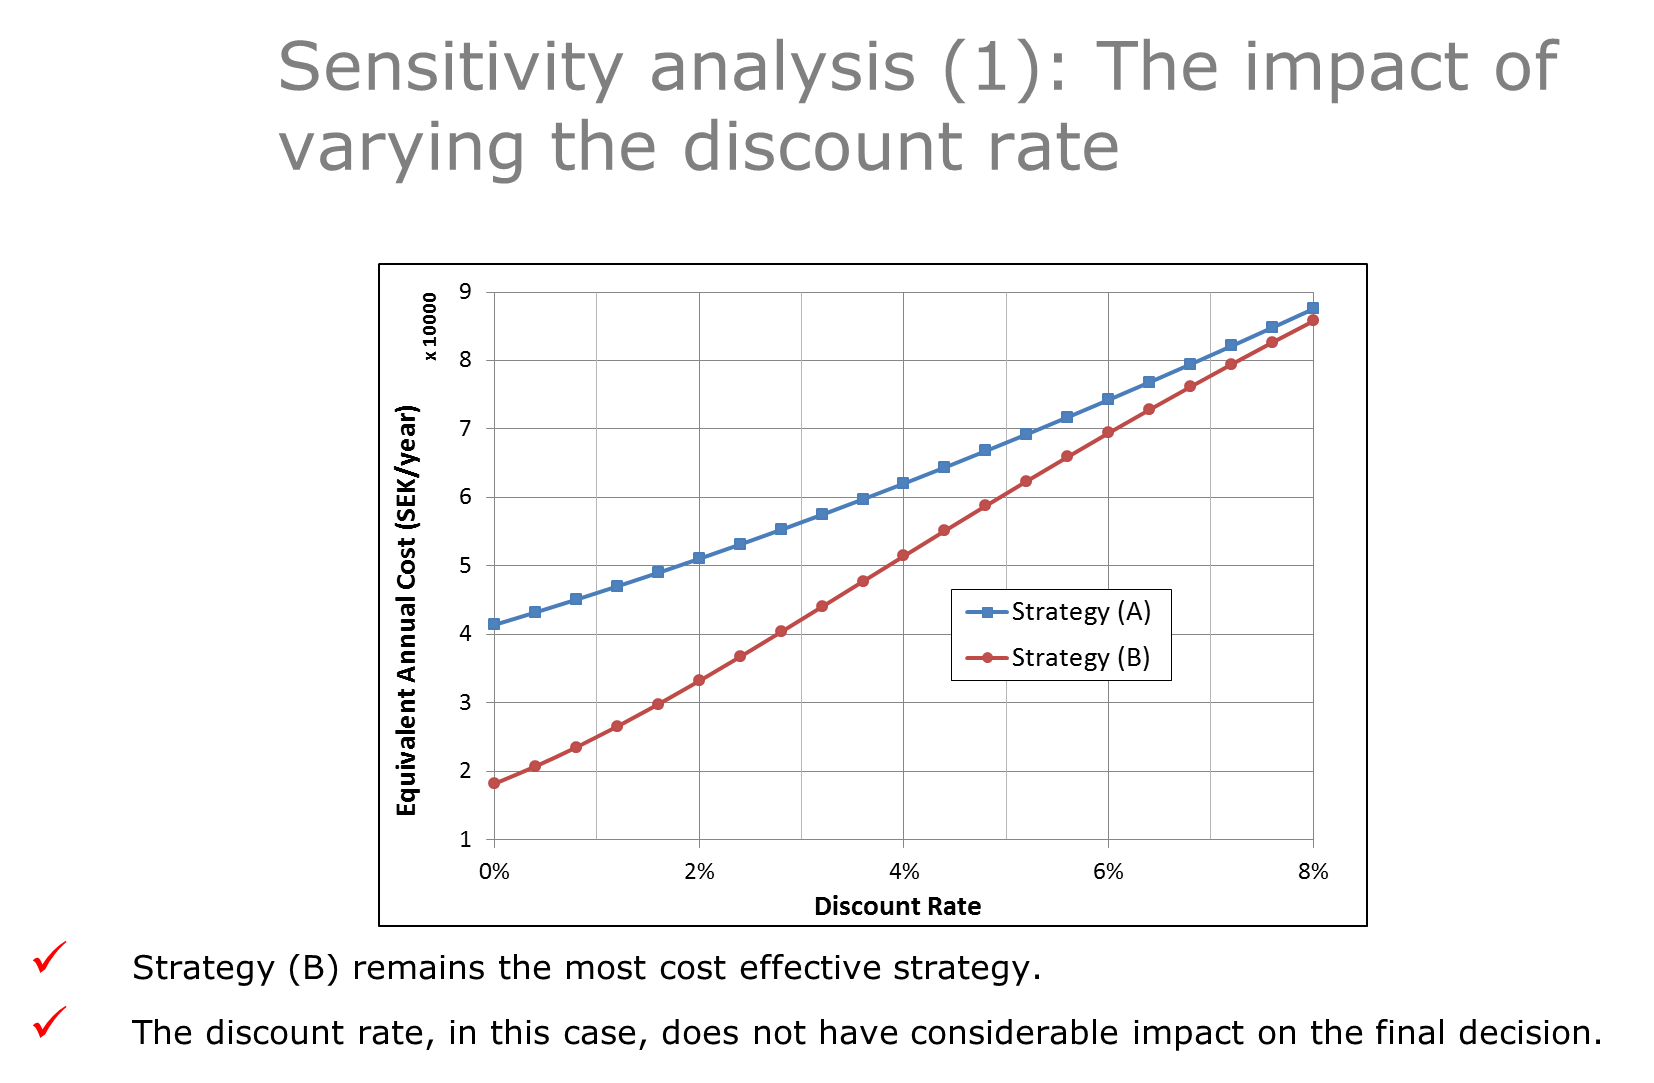
Figure 5‑6 The discount rate’s variation impact on final decision
If there is a possibility to negotiate the initial cost of strategy (A), it might be more profitable to choose it as the most cost-effective solution when its initial cost is less than 727,037 SEK instead of 895,000 SEK.
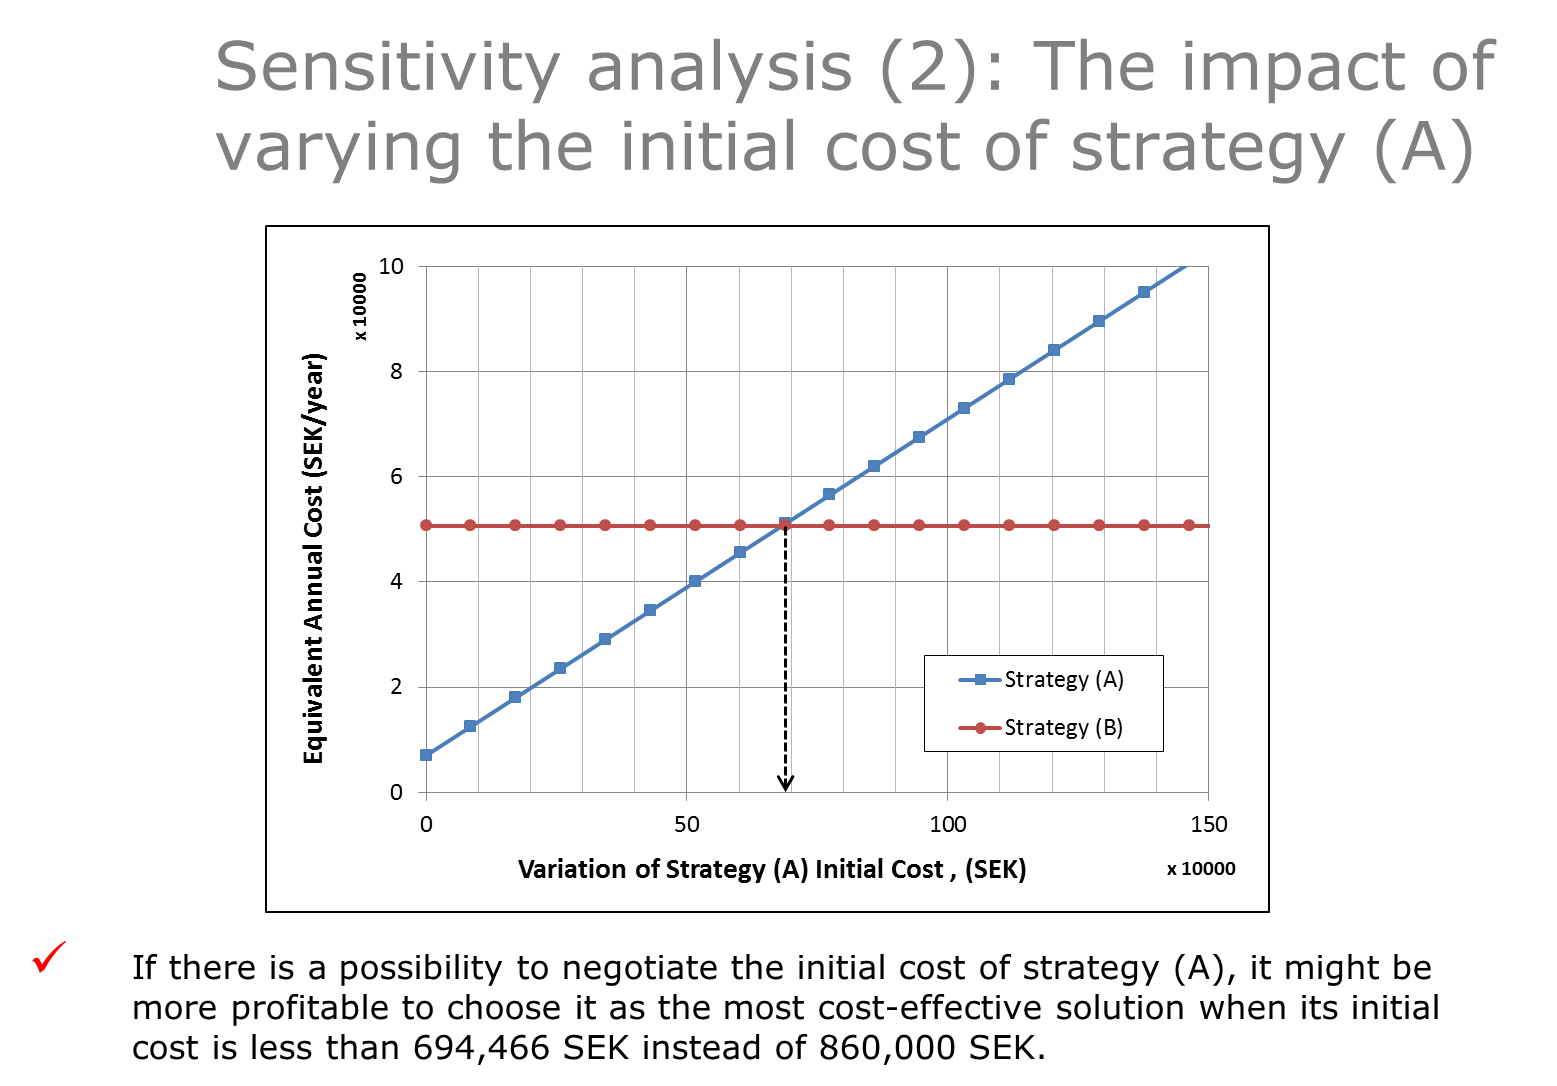
Figure 5‑7 The impact of varying the initial cost of strategy (A)
It is not an easy task to anticipate the long-term performance of the bridge or its individual structural members. The assessment of the service life extension after repair was assessed based on statistical treatment of an intensive historical data extracted from BaTMan related to similar actions performed on similar bridges. Therefore, the bridge’s service life extension after performing the repair strategy is subjected to uncertainties in the assessment. The impact of this uncertainty on the final decision was studied and presented in Figure 5‑8. Strategy (B) remains the most cost-effective choice while the bridge’s service life extension is less than 28 years, Figure 5‑8. If the repair strategy can guarantee a bridge’s service life extension longer than 28 years, then strategy (A) can be chosen as the most cost-effective choice instead of strategy (B). This is fairly impossible according to the feedback from the historical data. Therefore, this parameter, in this case, does not have that considerable impact on the final decision.
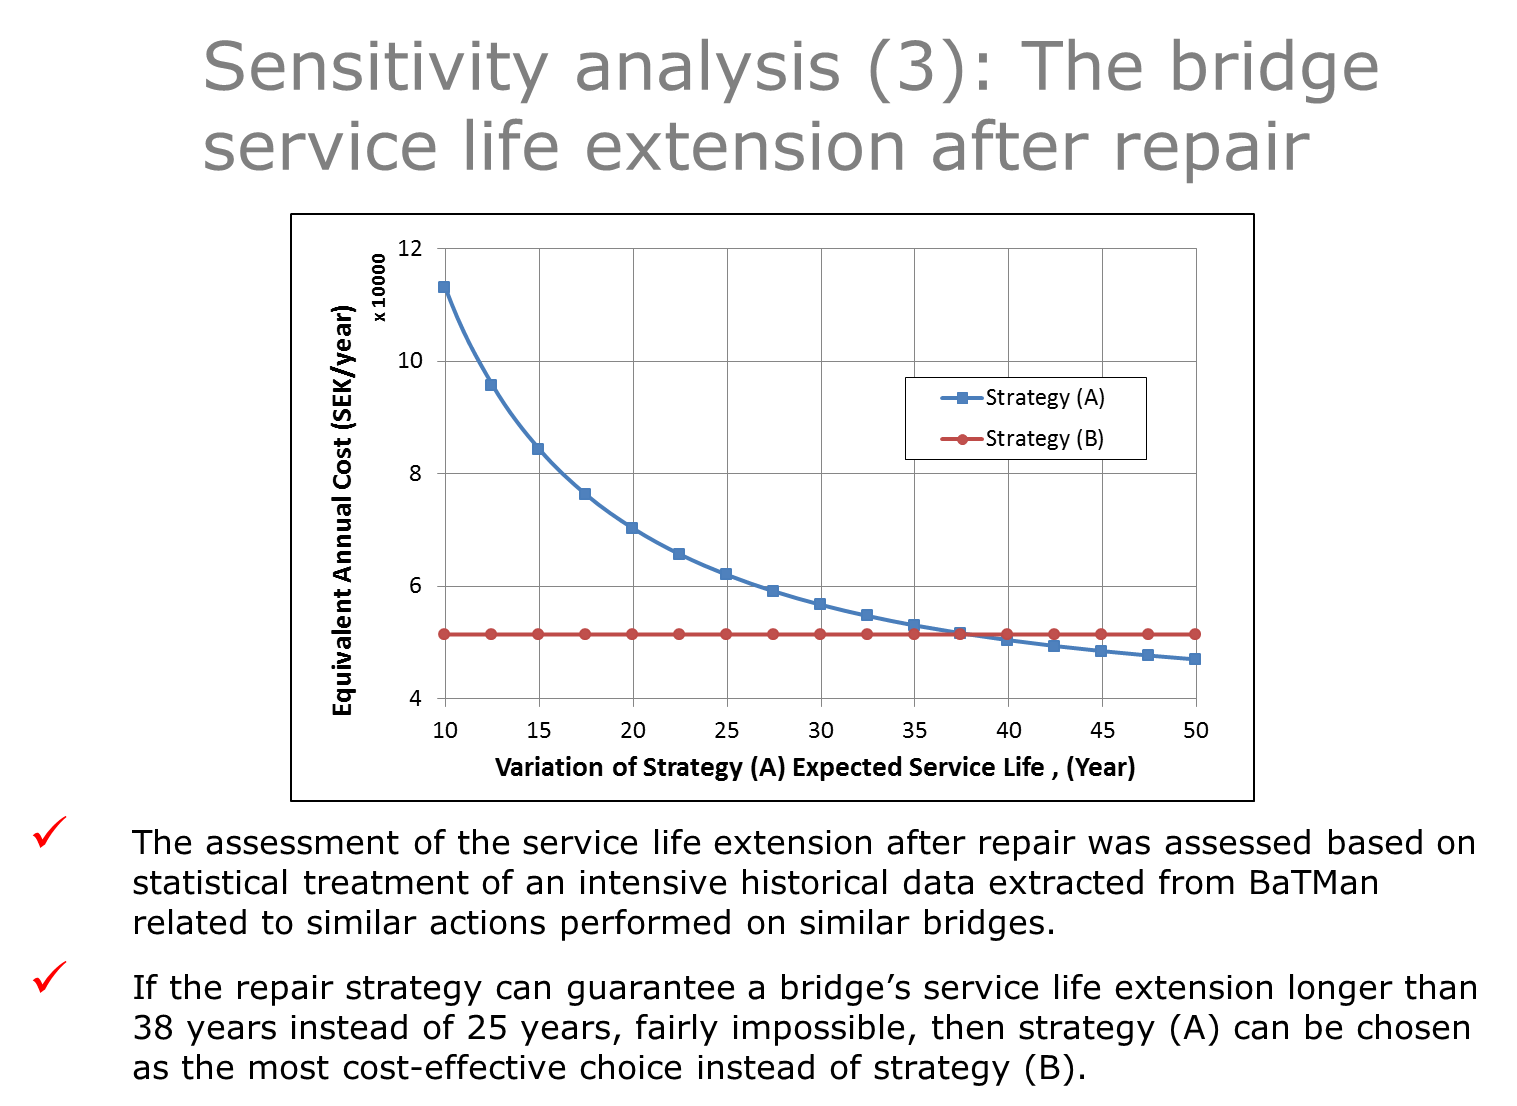
Figure 5‑8 The impact of varying the bridge’s expected service life extension on the final decision
The bridge’s residual service life without action, presented in Table 5‑2 is also subjected to uncertainty in the assessment. According to BaTMan’s inspection manual [20], bridges with such deterioration have to be more frequently inspected. The next year inspection results might assign the bridge superstructure and substructure CC2 also or CC3. A sensitivity analysis was conducted to study the impact of this uncertainty on the final decision, Figure 5‑9. This sensitivity analysis shows that, even if the three years in Table 5‑2 becomes zero (CC3), strategy (B) remains the most-cost effective, Figure 5‑9.

Figure 5‑9 The impact of varying the bridge’s residual service life on the final decision
1.1.6 Analysis including the bridge user cost
The traffic data on BaTMan is automatically updated each year as BaTMan is directly connected to the Swedish National Road Database (NVDB). Furthermore, it is possible to get a map and online-view for the bridge itself as well as its surrounding network. For this bridge case, the bridge has to be completely closed and the traffic has to follow a detour with an increased distance of 12.5 km. the user cost data used in the analysis are presented in Table 5‑4.
Table 5‑4 Bridge user cost assumptions
| Abbreviation | Description | Value | Unit |
| wp | The hourly time value for one passenger car | 100 | SEK/h |
| wT | The hourly time value for one truck | 196 | SEK/h |
| OT | The average hourly operating cost for one truck | 151 | SEK/h |
| OP | The average hourly operating cost for one passenger car | 67 | SEK/h |
| CF | The average cost per fatal deaths accident [6] | 10500000 | SEK/accident |
| CI | The average cost per serious injury accident [6] | 1120000 | SEK/accident |
| L0 | The optimum work zone length | 1500 | m |
| rTG | The traffic growth rate | 1.1 | % |
| LD | The length of the detour | 12500 | m |
| VD | The detour Speed | 68 | km/h |
| rT | The percentage of trucks from the AVD | 7 | % |
| An | The bridge accident rates during the normal condition | 3.15E-07 | accident/veh/day |
| Aa | The bridge accident rates during work activities | 1.15E-06 | accident/veh/day |
| r | The discount rate | 4 | % |
| PF | The average number of killed persons in bridge related accidents | 0.019 | Persons/Accident |
| PI | The average number of injured persons in bridge related accidents | 0.981 | Persons/Accident |
The bridge WZUC was calculated for the different strategies using the BaTMan-LCC program. Figure 5‑10 presents the NPV of the bridge user cost for both strategies.
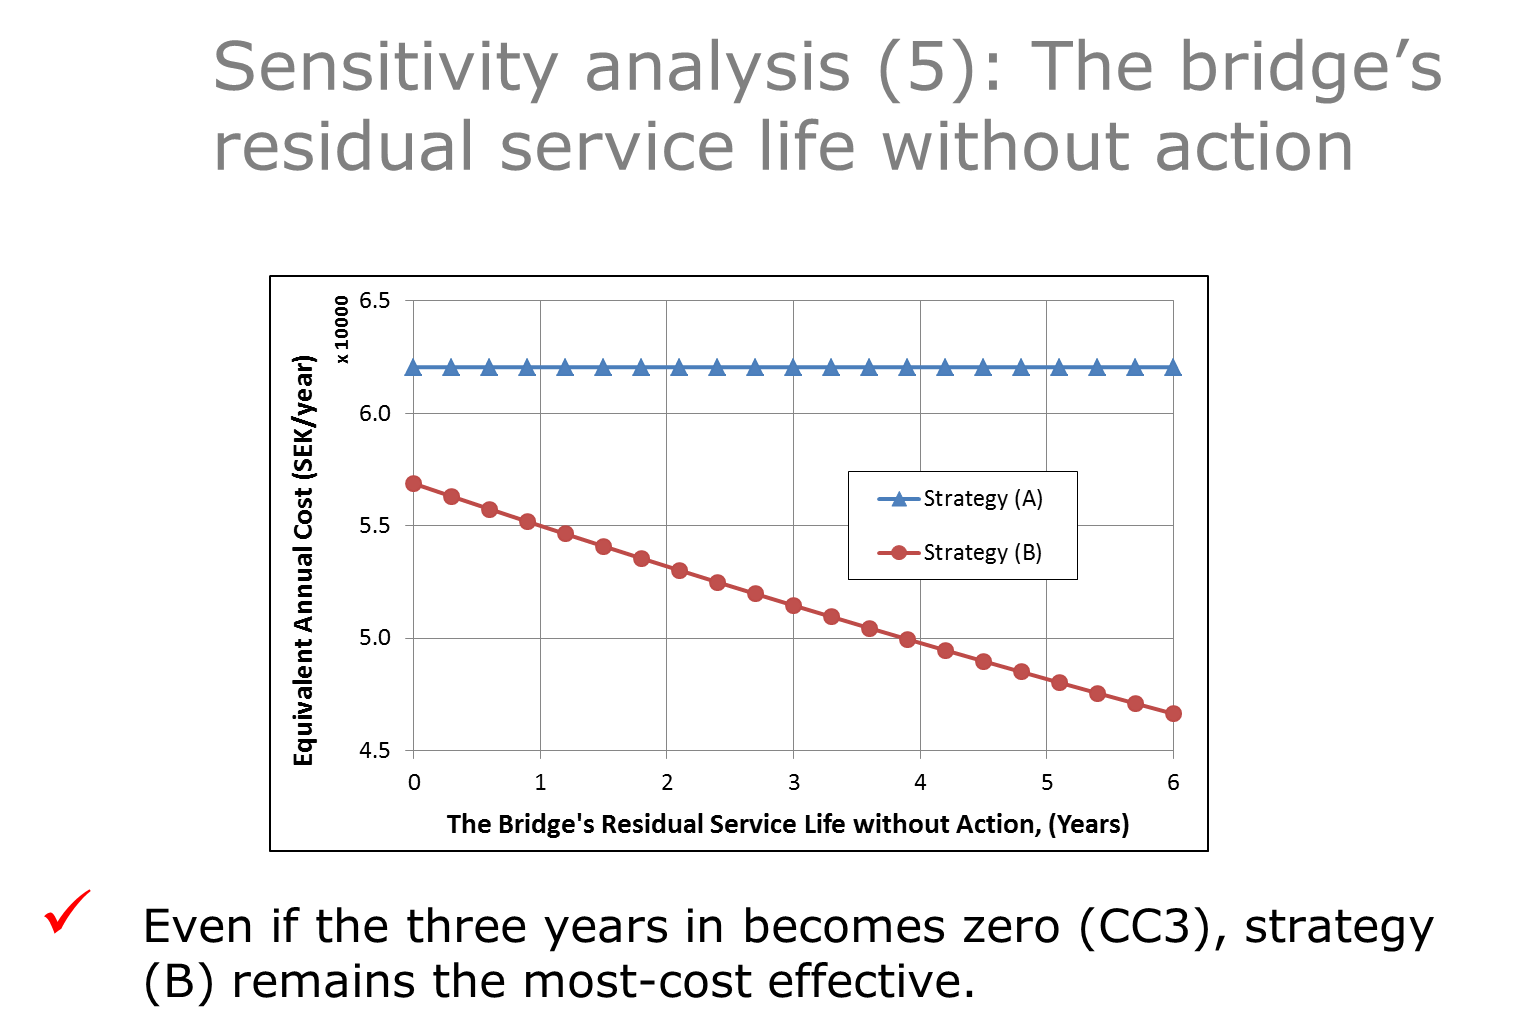
Figure 5‑10 Bridge user cost
By including the user cost in the analysis, the EAC for strategy (A) and (B) are presented in Table 5‑5. Consequently, strategy (B) remains the most cost-effective choice. By including the bridge user cost in the analysis, it will be more profitable to choose strategy (A) as the most cost-effective option when the repair’s initial cost becomes less than 402,706 SEK instead of 895,000 SEK.
Table 5‑5 LCC analysis results excluding the bridge user cost
| Cost Category &Term | Strategy (A) | Strategy (B) |
| Net Present Value (SEK) | 2,215,523 | 2,902,067 |
| Equivalent Annual Cost (SEK/year) | 163,022 | 126,798 |
The anticipated service life of the new concrete slab bridge is also subjected to uncertainty in the assessment. The impact of this uncertainty on the final decision was also studied. Strategy (B) remains the most cost-effective choice as much as the service life of the new bridge is longer than 33 years. It is fairly well known that the new steel open-bottom arch culvert, under normal conditions, can stand more than 40 years [13]. Therefore, the new bridge anticipated service life does not also have that considerable effect on the final decision.
Figure 5‑11 The impact of the new bridge anticipated service life
An alternative method of formulating the strategies is to consider a long-term planning. In this case, strategy (A) will comprise the immediate repair and a later renewal of the entire bridge after utilizing the repair’s anticipated service life extension, Figure 5‑12.

Figure 5‑12 Long-term planning for strategy (A)
Considering Figure 5‑12, the anticipated initial cost of building a typical new steel open-bottom arch culvert after 25 years from today (year 2035) is 1,609,300 SEK. The life span of strategy (A) in this case will be equal to 80 years instead of 20 years. For this strategy, the required annual O&M cost after the repair is assumed to be 7,000 SEK/year and the required annual O&M for the new bridge is assumed to be 2,500 SEK/year. Considering this long-term planning for strategy (A) and keeping the same specification of strategy (B), the analysis was performed. The EAC for strategy (A) and (B) are equal to 69,612 SEK/year and 60,497 SEK/year respectively. Consequently, strategy (B) remains the most cost-effective choice. The EAC of strategy (A) does not have that considerable variation in comparison with the short-term planning that is presented in Figure 5‑4. Therefore, it is recommended to only consider one action in each strategy without complicating the analysis by considering long-term planning.
Click here to add your own text
FOLKBRO AB